Mark-Recapture lab: something's fishy
Performed 18th of May
The mark-recapture laboratory experiment allowed students to gain insight on how biologists can measure the approximate size of a population by using black and white beans (aka fish) to study the method. A few handfuls of small white beans were put into a bag and then some were taken out and "marked", meaning they were replaced with black beans. Students repeatedly took handfuls out of the bag and counted the amount of marked and unmarked beans. After calculating the result, an approximate value representing the population size was found. Students observed that the margin of error in coming up with the correct population size was quite large. However, this method would still be very helpful to scientists in determining an estimation of the size of any given population. In this lab, students got to employ the mark-recapture method in a class environment and gain a better understanding of the perilous adventures of population ecologists by counting hundreds of beans.
The mark-recapture laboratory experiment allowed students to gain insight on how biologists can measure the approximate size of a population by using black and white beans (aka fish) to study the method. A few handfuls of small white beans were put into a bag and then some were taken out and "marked", meaning they were replaced with black beans. Students repeatedly took handfuls out of the bag and counted the amount of marked and unmarked beans. After calculating the result, an approximate value representing the population size was found. Students observed that the margin of error in coming up with the correct population size was quite large. However, this method would still be very helpful to scientists in determining an estimation of the size of any given population. In this lab, students got to employ the mark-recapture method in a class environment and gain a better understanding of the perilous adventures of population ecologists by counting hundreds of beans.
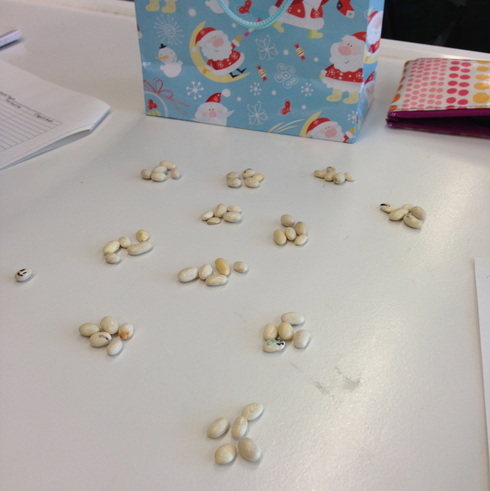
BEANS BEANS BEANS
Click here or here or here to view the laboratory instructions.
virtual transpiration lab
Performed 30th of April
The transpiration lab was completed online and led students through a set of information and questions (answered on a lab packet) about the means and purposes of transpiration in plants. This highlighted the important aspects of the topic and let students review some simple material for the AP exam. The images and short animations also assisted the process of answering the questions and visualizing what transpiration would look like. This lab combined information from several chapters covered from the Campbell Biology (9th edition) textbook.
Want to see the lab? Just click on the button.
Flower dissection lab
Performed 12th of February
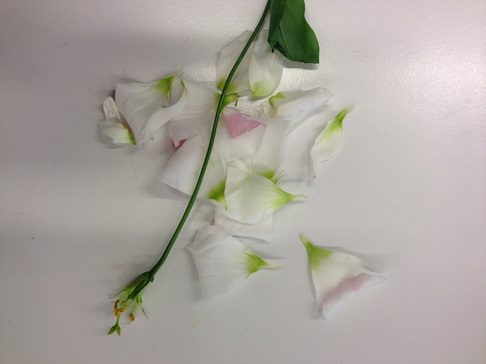
The flower dissection lab was not only about dissecting flowers. Surprised? The lab was actually made up of individual stations in which students could learn more about the structure of angiosperms. Flowers were indeed dissected, hence the title and image below, which uncovered the inner structure and exhibited how the pictures on paper would look in a physical plant. Furthermore, students got to examine enlarged and labeled sculptures of angiosperms as well as use various info sheets to complete the questions in the lab packet. The entire lab helped to give a more comprehensive overview of the structures and functions of the numerous aspects of flowering plants.
The flower dissection lab was not only about dissecting flowers. Surprised? The lab was actually made up of individual stations in which students could learn more about the structure of angiosperms. Flowers were indeed dissected, hence the title and image below, which uncovered the inner structure and exhibited how the pictures on paper would look in a physical plant. Furthermore, students got to examine enlarged and labeled sculptures of angiosperms as well as use various info sheets to complete the questions in the lab packet. The entire lab helped to give a more comprehensive overview of the structures and functions of the numerous aspects of flowering plants.
Blast comparative analysis lab
Started 9th of February
The BLAST lab was very relevant in showing students how molecular biology and computer technology can help scientists in figuring out evolutionary relationships between different organisms. Based on an image of a fossil, predictions had to be made about where this animal would fit on a given cladogram. Then, the BLAST tool was used to analyze several gene sequences of this animal and identify other organisms with a substantial amount of similar genes. Finally, a conclusion was drawn based on the presented data and students figured out that the animal was a chicken, since so many genes were identical when compared with BLAST. Through this experience, students could apply the knowledge learned in class concerning evolution and gene sequencing to a tool used in the daily lives of qualified scientists. The lab required students to analzye data and come to a concrete result.
Here is the link for the BLAST homepage : http://blast.ncbi.nlm.nih.gov/Blast.cgi
Here are the instructions students followed:
virtual bacteria lab
Performed 9th of February
This virtual lab was used to familiarize students with Gram staining and practical uses of bacteria in laboratories. Click on the button below to view the website used for the lab.
This virtual lab was used to familiarize students with Gram staining and practical uses of bacteria in laboratories. Click on the button below to view the website used for the lab.
hardy-weinberg lab
Performed 14th of January
During this lab, index cards with capital "A"s and lower case "a"s were handed out to students, which represented the alleles on their haploid chromosomes. Then students had to engage in some risque behavior to produce offspring genotypes with the cards. Each time, the new genotype had to be recorded and a new mate had to be found. After five generations, the frequency of the homozygous dominant, heterozygote, and homozygous recessive alleles was calculated. This process was repeated in four different cases that exhibited different conditions of selective pressure.
Students learned how to use the Hardy-Weinberg equations and analyze the extent to which allele frequencies change in contrasting circumstances. The lab taught students how population genetics and evolution interact to change the allele frequencies in populations exposed to different kinds of selective constraints.
And the mood was set.
Lab results and report:
| hardyweinberg_lab.pdf |
pom pom Lab
Performed 12th of January
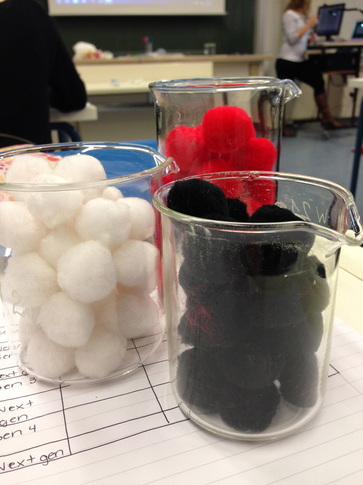
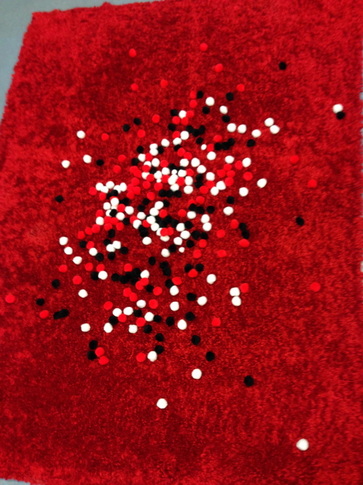
This particular experiment showed students how populations adapt to their environments when exposed to selective pressures. The predators (the students) set out to gather as much nutrition (the pom poms) as they could with the hunting traits that were randomly given to them (fork, knife, or spoon). Since the Magical Carpet Environment on the picture below was red, the red pom-poms were eaten last, as they blended in with their surroundings well. Students with spoon claws could gather food much more efficiently than students with knife or fork claws, which led to a decrease in the population of predators with less advantageous claws from generation to generation.
Both the prey and predator populations evolved due to natural selection favoring traits that would lead to an increase in fitness of the organisms. The animals that could gather the most food or hide from predators efficiently would have a better chance at surviving to produce offspring. The observations showed how the rules of natural selection could apply to populations in an imaginary (and somewhat magical) environment.
Click here to view the results and conclusion:
|
| ||
gel electrophoresis lab
Performed 18th of December
In this experiment, students had to find out which of three suspects committed a theft by using an analysis of two blood samples found on the scene. The student scientists used restriction enzymes to cut each sample of DNA into RFLPs. Then gel electrophoresis was used to create a DNA fingerprint for the two blood samples and all three suspects. Lastly, a radioactively labeled nucleic acid probe for Huntington's disease was used to analyze the individual DNA samples. The probe attached to a complementary sequence on one piece of evidence and one suspect sample. After the evidence and suspect DNA fingerprints were compared, students concluded that the blood of Suspects 1 and 2 was found on the crime scene. The objectives of this lab were to simulate gel electrophoresis and gain an understanding of how it could be used to solve crimes. Observations of how to use restriction enzymes and create DNA fingerprints in this process were made as well, giving students a good idea of the application of gel electrophoresis in the real world.
Click on the document below to view the lab information and report:
| gel_electrophoresis_lab.pdf |
We also performed an online version of gel electrophoresis:
restriction enzyme lab
Performed 17th of December
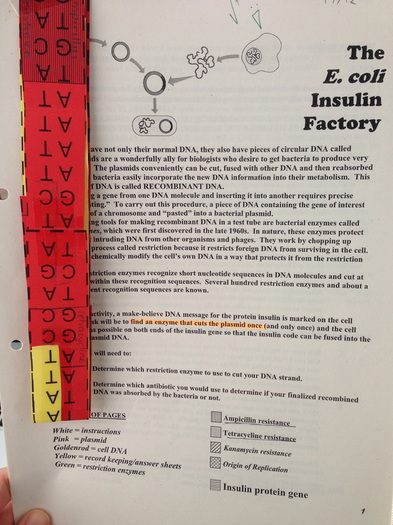
This experiment was designed to show students how a gene of interest can be introduced into a plasmid and then used for replication and/or synthesis of a targeted protein. Both the plasmid and DNA sequence had to be checked for use of the correct restriction enyzme. The correct one turned out to be Eco RI, since it cut the plasmid once and the DNA twice. Then the gene of interest could be inserted into the plasmid via the sticky ends produced by Eco RI. The original plasmid was resistant to tetracycline and ampicillin, which would allow the student scientists to (figuratively) check whether the cells had acquired a plasmid or not. The ones that did not acquire a plasmid would have died on the ampicillin and tetracycline growth medium. This activity showed students how plasmids may be used and manipulated by scientists for medical or research purposes. The image below shows the lab packet with a folded up version of the recombinant plasmid.
This experiment was designed to show students how a gene of interest can be introduced into a plasmid and then used for replication and/or synthesis of a targeted protein. Both the plasmid and DNA sequence had to be checked for use of the correct restriction enyzme. The correct one turned out to be Eco RI, since it cut the plasmid once and the DNA twice. Then the gene of interest could be inserted into the plasmid via the sticky ends produced by Eco RI. The original plasmid was resistant to tetracycline and ampicillin, which would allow the student scientists to (figuratively) check whether the cells had acquired a plasmid or not. The ones that did not acquire a plasmid would have died on the ampicillin and tetracycline growth medium. This activity showed students how plasmids may be used and manipulated by scientists for medical or research purposes. The image below shows the lab packet with a folded up version of the recombinant plasmid.
|
The results of the experiment and answered questions can be found in the document below:
| ||
Chi Square Lab
Performed 12th of November
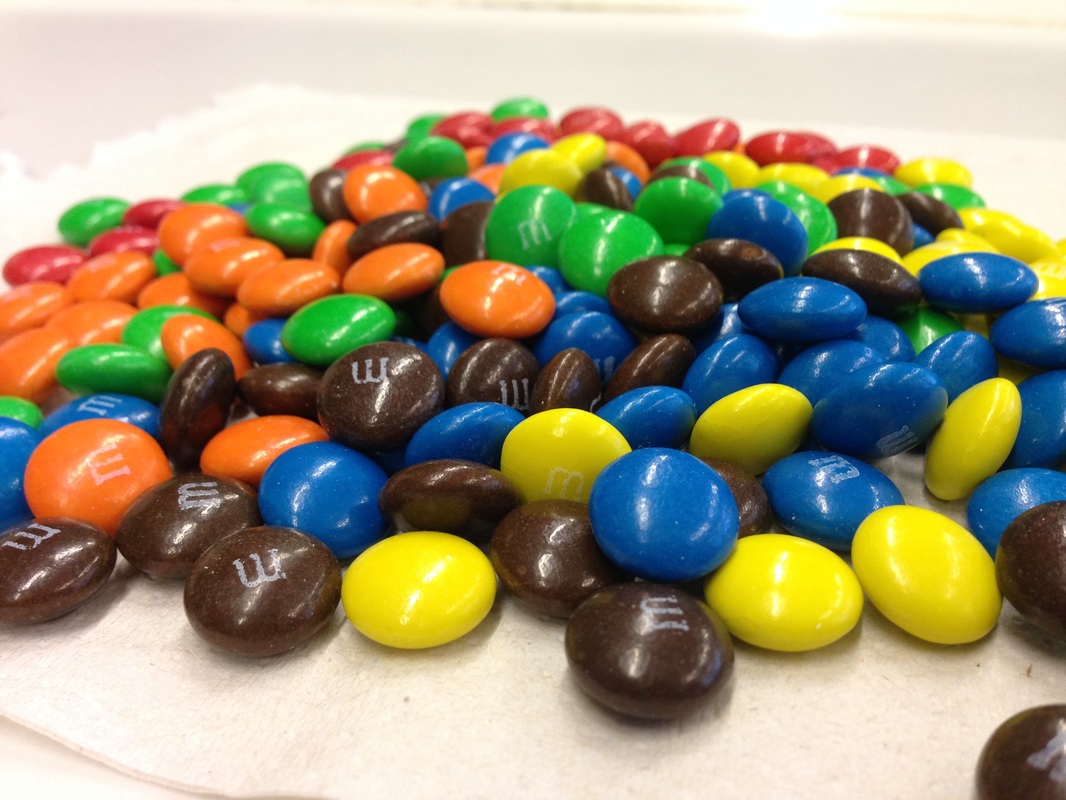
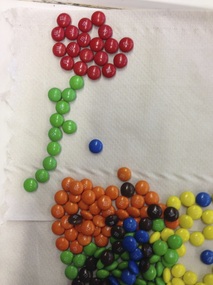
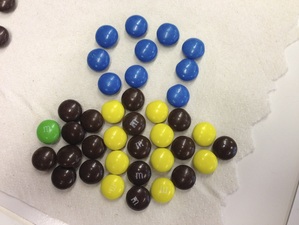
The Chi-Square Lab was carried out using colorful M&Ms. This experiment allowed students to use the methods of Chi-Square analysis to evaluate whether the amount of red, brown, orange, green, etc. candies in M&M baggies was completely due to chance or not. The candies were counted and the equation was used to come up with Chi-Square values, which were then compared to the results from other groups. Overall, students rejected the null hypothesis based on comparison with the critical value, meaning that the differences between observed and expected values had to be due to other factors than just random chance. Students could apply this statistical method of data analysis to M&Ms, which allowed for an improved understanding of the scientific objective and utilization of Chi-Square.
Click here to see all of the lab information, results, and conclusion:
| chisquare_lab.pdf |
|
|
|
ap lab #7 - Cellular division
Performed 30th of October
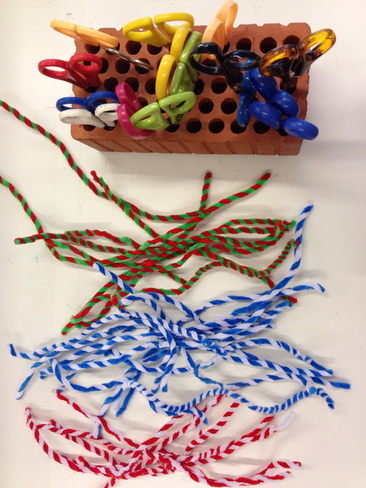
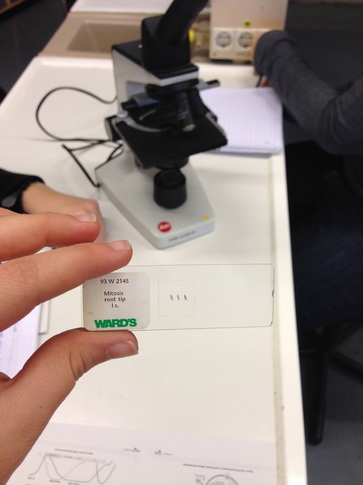
Cellular division plays an essential role in reproduction, growth, and repair. This lab allowed students to gain a general idea of what plant cells look like in various stages of mitosis by viewing a slide of root tips (image on the bottom right). The amount of cells in each stage of mitosis was counted and showed how short or long the different phases take. Since most cells were in interphase, that phase would take the longest. Students were also required to perform and analyze a karyotype by cutting out chromosomes and taping the homologous pairs onto the Denver System Worksheet. Additionally, students simulated the process of mitosis and meiosis using the materials shown in the left image below. By carrying out these steps, students familiarized themselves with the mechanism and applications of mitosis and/or meiosis.
Full pre-lab, post-lab, and results:
| ap_lab7_cell_division.pdf |
|
|
ap lab #6 - cellular respiration
Performed 16th of October
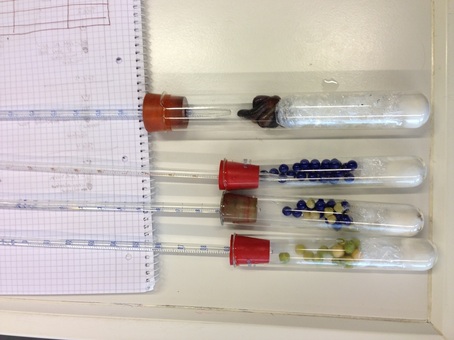
The purpose of AP Lab #6 was to demonstrate how the rate of cellular respiration could be measured using respirometers. Students measured the rate of oxygen consumption of various materials: germinating peas, glass beads, non-germinating peas, and even live worms (shown on the image below). The results revealed that worms had the highest rate of respiration and therefore used the most oxygen. The glass beads served as the control and obviously consumed no oxygen. In analyzing the data and forming conclusions, students were challenged to think about the effects of temperature, pressure, oxygen, and animal type on the process of cellular respiration.
A complete version of the lab report can be found here:
| ap_lab6_respiration.pdf |
|
RESPIROMETERS
|
AP lab #5 - photosynthesis
Performed 8th of October
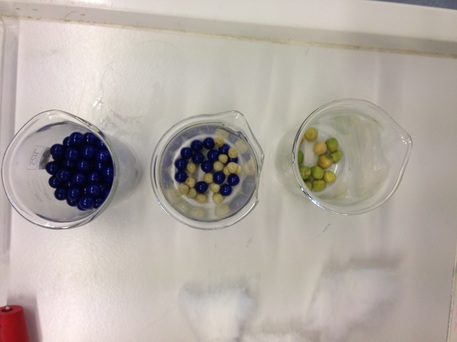
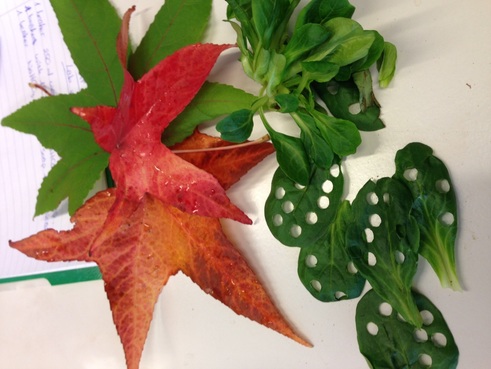
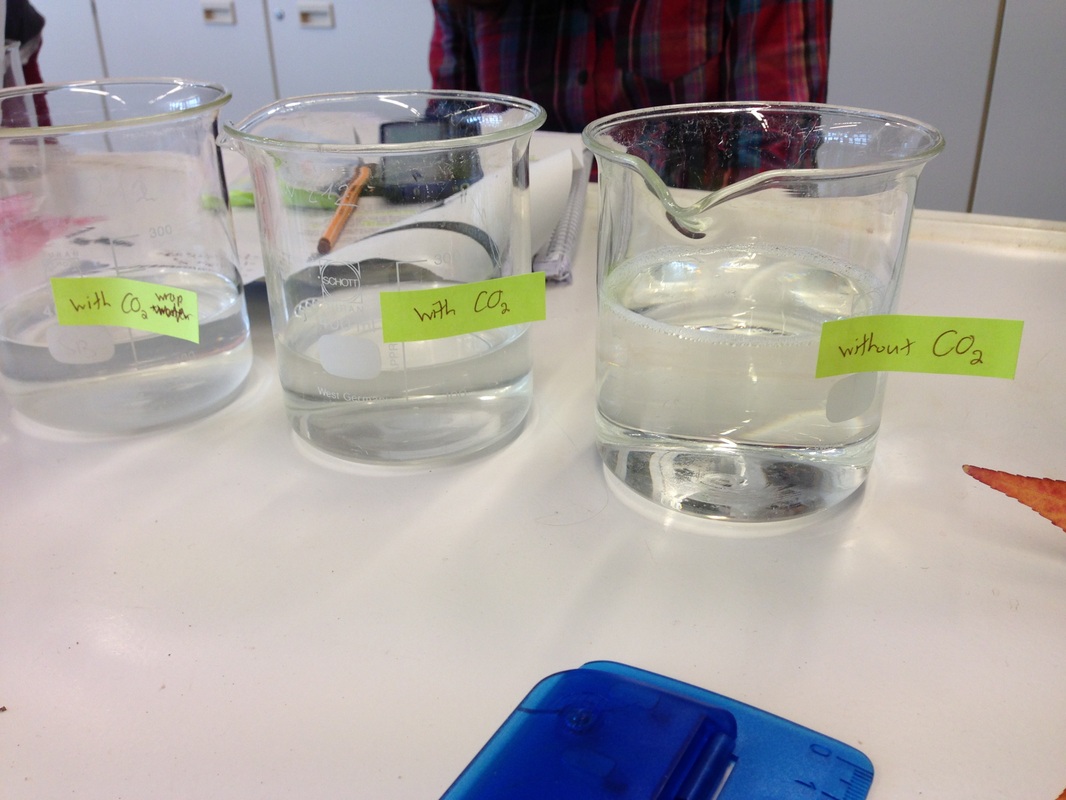
In this experiment, the rate of photosynthesis in green leaves from field salad was measured. Students used syringes to draw the gases out of the leaf disks so they would sink and then measured how fast they rose again in three different solutions. The results showed that the fastest rate of photosynthesis occured in the beaker with a light, water, and carbon dioxide source compared to the beaker without carbon dioxide and the beaker with a red film of plastic wrap over the top. This showed that the rate of photosynthesis in the chloroplasts of the leaves could be affected by different factors, such as wavelength of light and sufficient carbon dioxide. The objective was for students to explore these factors and understand the properties and behaviors of gases during photosynthesis.
In this experiment, the rate of photosynthesis in green leaves from field salad was measured. Students used syringes to draw the gases out of the leaf disks so they would sink and then measured how fast they rose again in three different solutions. The results showed that the fastest rate of photosynthesis occured in the beaker with a light, water, and carbon dioxide source compared to the beaker without carbon dioxide and the beaker with a red film of plastic wrap over the top. This showed that the rate of photosynthesis in the chloroplasts of the leaves could be affected by different factors, such as wavelength of light and sufficient carbon dioxide. The objective was for students to explore these factors and understand the properties and behaviors of gases during photosynthesis.
| ap_lab5_photosynthesis.pdf |
|
|
ap lab #4 - inquiry
Performed 25th of September (Redo October 1st)
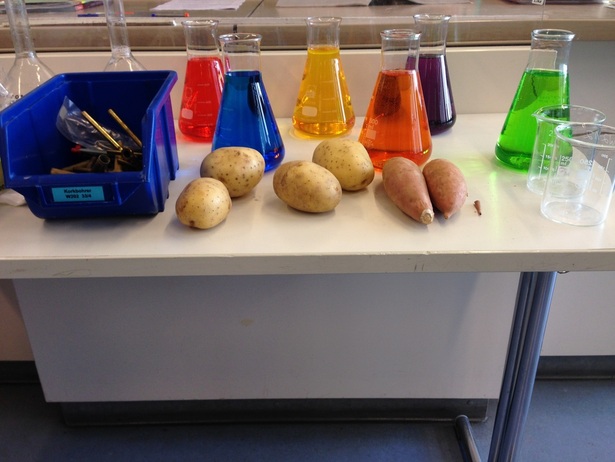
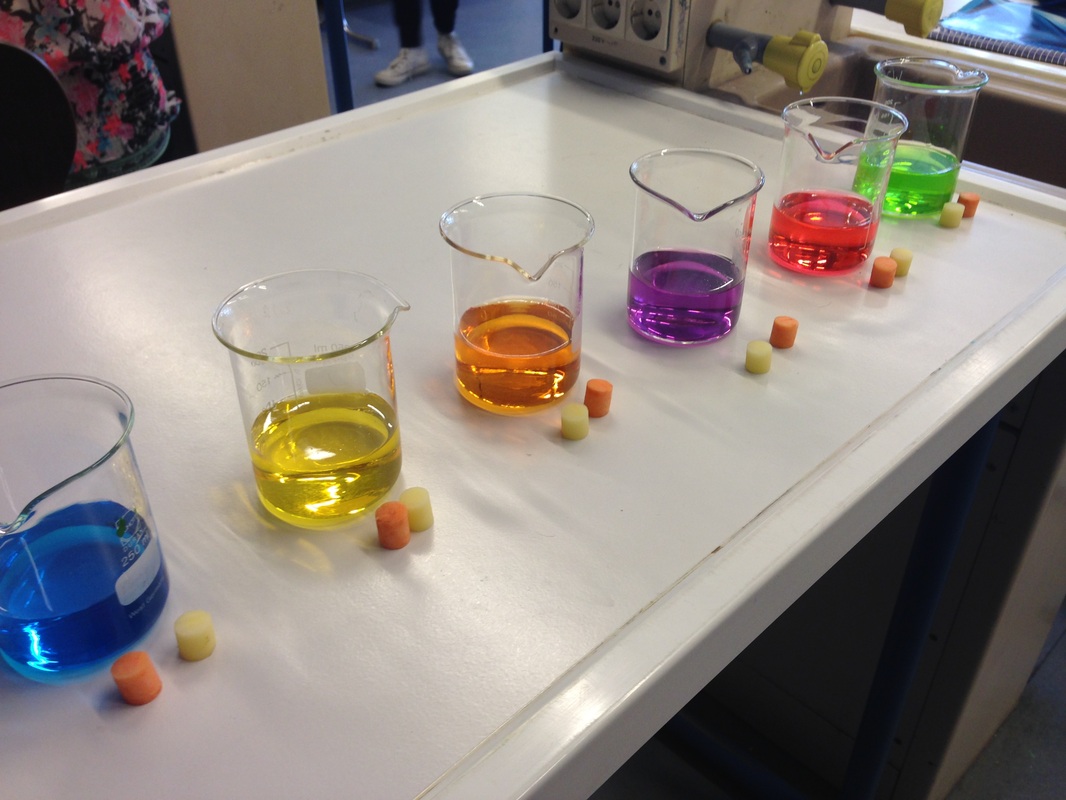
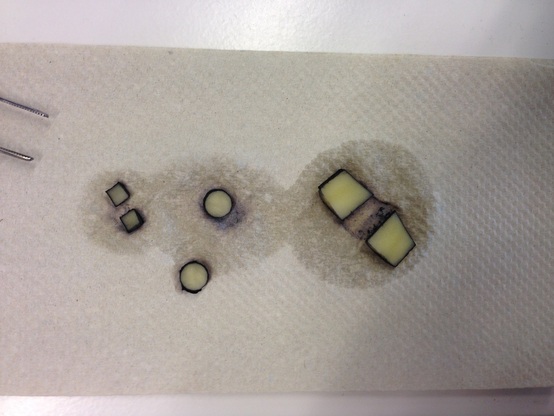
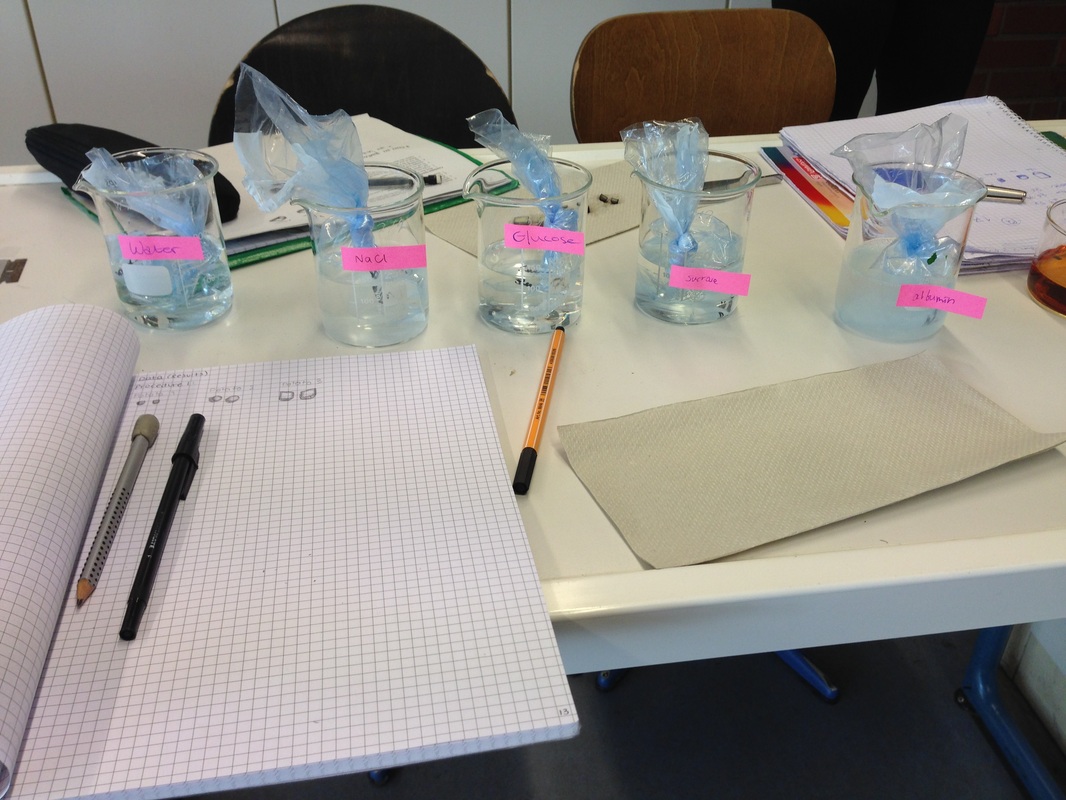
The purpose of the inquiry for AP Lab #4 was to allow students to modify the lab and design new experiments to show how diffusion and osmosis function in cells. Students performed an inquiry experiment for each part of the original lab. The first part was done with grapes and salt solution, which proved to be somewhat inconclusive, since it did not accurately portray the relationship between surface area and volume. In the second part, students observed the diffusion of several liquids into glucose solution through a semi-permeable membrane (plastic bag). The third part of the inquiry experiment was challenging and had to be modified and performed again on a later date. Students were supposed to figure out a way to find the molarities of six different glucose solutions, a white potato, and a sweet potato. Ultimately, the results were not easy to decipher, however, once the molarities of the solutions were known, the molarity of the potatoes could be found by observing the rules of diffusion from a higher to a lower concentration.
Full report:
| ap_lab4_inquiry.pdf |
|
|
ap lab #4 - diffusion and osmosis
Performed 22nd of September
AP Lab #4 was divided into three parts, all of which focused on different aspects of diffusion, osmosis, and water potential in cells. Students were supposed to learn why cells are so small, investigate the relationship between different solutions on opposite sides of a semi-permeable membrane, and observe the affects of a solution on the cells of a red onion. The results showed that cells are so tiny due to the effects of surface area to volume ratio, which can affect how fast nutrition gets to the middle of the cell. The effects of plasmolysis were observed in the plant cell, after the cell membrane pulled away from the cell wall, due to loss of water. Lastly, the results from the cell models showed an increase in weight for each individual cell including the control, which generated a more difficult set of data for interpretation. That part of the experiment was supposed to show how water potential (and solute concentration) affected the diffusion between the inside and the outside of the "cell".
This is the link to the full lab report:
| ap_lab4_diffusion_and_osmosis.pdf |
|
|
|
ap lab #13 - enzymes
Performed 10th of September
In the first AP Lab, students were supposed to learn how enzymes work and which factors may influence their function. There are many different factors that can influence enzyme activity, including but not limited to temperature, denaturation, competitive inhibition, and enzyme to substrate ratio, all of which were tested in this lab. Students found that enzyme to substrate ratio and competitive inhibition affect the rate of reaction, while denaturation and temperature can dramatically inhibit enzyme activity.
Full prelab and report:
| enyzme_prelab.pdf |
| ap_lab_enzymes.pdf |
composition of cells lab
Performed 3rd of September
The objective of the Composition of Cells Lab was to learn how to test for certain building blocks of macromolecules (i.e. lipids, proteins, and carbohydrates). Students should have observed which chemicals test for the presence of the different monomers of macromolecules and gained an understanding of what cells are made up of. The findings showed that Biuret's reagent tests positive for proteins and polypeptides in the presence of albumin and pepsin, iodine solution tests positive in the presence of starch, Benedict's solution tests positive for sugars, and lipids can be identified by using a brown paper bag.
The full report can be found here:
| cell_comp_lab.pdf |
Sinkin' Lincoln lab
Performed 27th of August
In the Sinkin' Lincoln Lab, the purpose was to find out how the surface tension of water can be affected by soap and understand the cohesive properties of water. After we tested water and soapy water on the penny individually, the results showed that the average amount of drops of regular water that stayed on the surface of the penny was almost double the amount of soapy water drops that stayed on. This means that the soap lowered the surface tension of the water, restricting water's ability to stick to itself.
Find the lab report here:
| sinkin_lincoln_lab.pdf |
reflection
What was the most memorable lab experience you had this year? Why was it so memorable?
In which lab did you learn the most? Explain how it helped you learn the concepts.
The most memorable laboratory experiment I had this year was AP Lab #4 (inquiry), about diffusion and osmosis. In this lab, students used white and sweet potatoes to study the effects of hypotonic and hypertonic solutions on water potential. We made an error in performing the lab for the first time, so we had to redo some parts of the experiment, which is one of the reasons why I remember it so well. This lab forced us to figure out what mistake we had collectively made and understand how we could remedy that mistake. After the first try, I had a very hard time trying to come up with good conclusions to draw from it. The results of the experiment did not make enough sense for me to interpret correctly, so even though this was one of the most difficult experiments, I also learned the most. Having to analyze our performance and reflecting on the lab certainly improved our capacity to master the content properly.
As a result of this experiment I became much more familiar with the concept of water potential and where water moves in various environments. I studied the information covered in the lab more intensely because of the confusion I had experienced in the experiment at first. This allowed me to learn a lot about solutions, water potential, and osmosis.
How has your understanding of scientific reporting and presentation improved from the start of the year?
At the beginning of the year, my knowledge of scientific reports was limited to writing a hypothesis and making representative graphs. After one year of AP Biology, my laboratory reporting has improved greatly. I have learned to write in a very factual way and keep out the opinions and unnecessary information. Also, the way in which I write or graph data has become more organized. This obviously helps when trying to analyze observations and charts.
I now know how to write an introduction to a lab and set up the materials and procedure, as well as integrate the data. Probably most importantly, I learned how to draw logical conclusions from what I observed and wrote down into the lab notebook. I improved my skills in formulating answers to questions, refuting/supporting a hypothesis, and basing my arguments on factual information.
What is the most valuable lesson or skill that you've learned through your lab experience this year?
I believe that the most valuable skill I have learned throughout my experiences in the laboratory is learning to remove bias from the equation. Obviously this is not entirely possible, but scientific study aims to remove personal opinion and predispositions to allow for an exclusive interpretation of facts, not subjective opinion. This aspect of my lab experience certainly shaped the way I think about factual writing and reporting, which will most definitely help me to evaluate scientific information in the future.
